ChartTrader
V tomto článku vám ukážeme, jak získat přístup k nástroji ChartTrader a jak jej nakonfigurovat. Také vám vysvětlíme, jak vytvářet, upravovat či rušit příkazy přímo v grafu.
Přístup k nástroji ChartTrader
- Přihlaste se do obchodní platformy Trader Workstation (TWS). Pokud ještě nemáte platformu TWS nainstalovanou, můžete si ji stáhnout zde.
- Otevřete okno s parametry grafu kliknutím na ikonu Graf v horním panelu platformy TWS. V nově otevřeném okně zadejte do pole Podklad název, ticker či ISIN finančního instrumentu, u kterého chcete zobrazit graf a stiskněte Enter. Z následného seznamu zvolte vámi požadovaný instrument a potvrďte kliknutím na tlačítko OK.
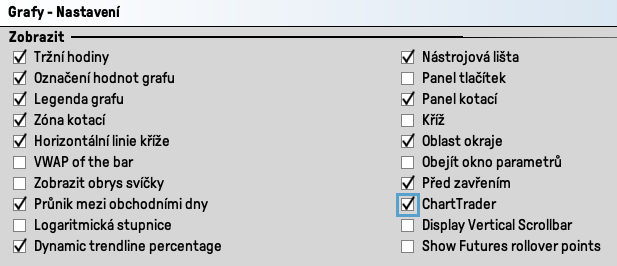
- V okně s grafem klikněte v levém horním rohu na kartu Editovat a zvolte možnost Globální nastavení grafu. V levé časti nově otevřeného okna zvolte Grafy > Nastavení. Následně se ujistěte, že v pravé části okna je zaškrtnuté pole ChartTrader. Vaši volbu potvrďte kliknutím na tlačítko Použít a poté na OK.
Vytvoření příkazu s výchozím nastavením
V této části vám ukážeme krok po kroku, jak vytvořit příkaz v nástroji ChartTrader pomocí panelu Tlačítka.
- Otevřete okno grafu a klikněte na kartu Editovat v levém horním rohu. Poté zvolte možnost Globální nastavení grafu.
- V části Zobrazit na levé straně okna zaškrtněte pole Panel tlačítek. Potvrďte svou volbu kliknutím na tlačítko Použít a poté na OK.
- Alternativně můžete v okně grafu kliknout na kartu View a zaškrtnout možnost Panel tlačítek.

- Pro vytvoření příkazu klikněte v panelu Tlačítka na tlačítko Buy (nakoupit) nebo Sell (prodat) tlačítko. Přímo v grafu se zobrazí modrá vodorovná čára, která indikuje potenciální vstupní bod. Vstupní cenu můžete upravit, přetažením modré čáry.
Poznámka: Pokud se v grafu nezobrazuje modrá vodorovná čára, pravděpodobně máte defaultně nastavené příkazy typu market (MKT). Pro změnu defaultního nastavení typu příkazu klikněte na kartu Editovat a zvolte Globální nastavení grafu. Na levé straně klikněte na záložku ChartTrader. Poté na pravé straně zvolte možnost Tlačítka a následně klikněte na tlačítko Použít výchozí. Svou volbu potvrďte kliknutím na tlačítko Použít a OK. - Vedle modré čáry se zobrazí tlačítka T (přenést) a CXL (zrušit). Pro zrušení nechtěných příkazů klikněte na tlačítko CXL.
- Pro přenesení příkazu na trh klikněte na tlačítko T na levé straně modré čáry nebo použijte tlačítko Přenést v záložce Příkazy nacházející se pod samotným grafem.
- Následně zkontrolujte parametry příkazu v okně Potvrzení příkazu. Pokud jste s nastavením svého příkazu spokojeni, přeneste jej na trh kliknutím na tlačítko Nebrat v úvahu a přenést.
Konfigurace příkazu
Svůj příkaz můžete v nástroji ChartTrader upravit dvěma způsoby:
- Záložka Příkazy: Přímo v panelu ChartTrader můžete upravit parametry příkazu, jako je typ příkazu, cena příkazu nebo doba jeho platnosti. Pro změnu konkrétního parametru klikněte levým tlačítkem příkazu na příslušný sloupec.
- Rozhraní grafu: Klikněte pravým tlačítkem myši na modrou vodorovnou čáru. Z nabídky zvolte Změnit > Příkazový lístek.
Zde nastavte parametry příkazu a svou volbu potvrďte kliknutím na tlačítko Přenést.

Ohraničené příkazy
Ohraničené příkazy (TP a SL) můžete připojit kliknutím pravým tlačítkem na modrou vodorovnou čáru a najetím myši na položku Připojit. Poté ze seznamu zvolte možnost Ohraničené příkazy. Do grafu budou následně přidány další čáry. Tažením čáry můžete upravit cenu příkazů. Můžete také využít záložku Příkazy nacházející se pod grafem.
Poznámka: Ohraničené příkazy budou aktivovány po vyplnění nadřazeného příkazu.
Pokročilé nastavení
Jakmile se s nástrojem ChartTrader seznámíte, můžete prozkoumat jeho pokročilé funkce a zdokonalit tak své grafy.
- Klikněte na Editovat v levém horním rohu okna grafu.
- Následně zvolte možnost Globální nastavení grafu.
- Na pravé straně okna zvolte Grafy > ChartTrader. Tím se otevře rozcestník nastavení, kde lze upravovat řadu parametrů.
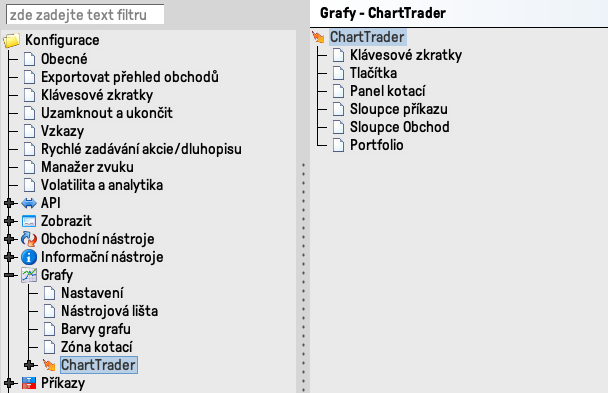
- Klávesové zkratky: Nastavte klávesové zkratky a zkratky myši pro efektivní práci s grafy. Dostupné a aktivované klávesové zkratky najdete v části Konfigurované zkratky.
- Tlačítka: Aktivujte panel tlačítek v okně grafu a přizpůsobte jej přidáním nebo úpravou tlačítek.
- Panel kotací: Upravujte a přidávejte sloupce. Sloupec Nerealizovaný zisk/ztráta můžete přidat rozbalením položky Pozice a ZaZ na pravé straně. V rozbaleném seznamu dvakrát klikněte na možnost Nerealizovaný ZaZ. Potvrďte svou volbu tlačítkem Použít.
- Sloupce příkazu a Sloupce Obchod: Přizpůsobte dané sloupce přidáním nových nebo odstraněním těch, které již nepotřebujete.
- Portfolio: Přidávejte a odebírejte sloupce s užitečnými údaji o vašich stávajících pozicích v portfoliu.
Často kladené dotazy
V rámci nástroje ChartTrader můžete obchodovat se všemi typy finančních instrumentů.
Pro obchodování nejen v rámci nástroje ChartTrader není zapotřebí mít předplacená tržní data v reálném čase.
V případě, že uvažujete o předplatném tržních dat pro konkrétní trhy, můžete tak učinit kliknutím na tento odkaz.
Grafy SMART vyhodnocují a porovnávají tržní data z různých burz a obchodních systémů pro konkrétní finanční instrument a prezentují tedy nejvýhodnější kotace.
Aby bylo možné využívat grafy SMART v reálném čase, je nezbytné aktivovat předplatné tržních dat pro všechny burzy, na kterých se obchoduje (ve stejné měně) s vašimi finančními instrumenty. Návod, jak si předplatit tržní data, naleznete zde.
Pokud chcete, aby se vám v grafu zobrazovaly živé kotace pouze z jedné konkrétní burzy, tedy nechcete využívat Smart grafy, je nejprve nutné předplatit tržní data pro danou burzu.
- Následně v obchodní platformě TWS zadejte ticker daného titulu do sloupce Financial instrument ve watchlistu a stiskněte Enter. Klikněte na položku Akcie (směrované), vyberte požadovanou burzu a potvrďte váš výběr kliknutím na tlačítko OK. Pokud tato položka není v nabídce viditelná, klikněte na malou šipku dolů na konci seznamu a odkryjte ostatní skryté položky.
- Po přidání titulu do watchlistu v sloupečku Financial Instrument naleznete za tickerem zkratku zvolené burzy, před kterou je znak @.
- Nyní klikněte pravým tlačítkem myši na název titulu a přejdete na položku Grafy > Nový graf.
- Po nastavení všech parametrů grafu v nově otevřeném okně Parametry grafu klikněte na tlačítko OK. Na levé straně panelu nástrojů nad grafem se za symbolem kontraktu zobrazí vámi vybraná burza se znakem @. Tento znak označuje, že se jedná o směrovaný (directed) graf.